About Vvidget
Vvidget is straightforward: • Makes graphs from numbers. • Made by the data visualization expert - VVI(R). • Touch-hold a graph to email, print or save to your Photo Album. • Plenty of built-in options. • AirDrop your
Vvidget is straightforward:
• Makes graphs from numbers.
• Made by the data visualization expert - VVI®.
• Touch-hold a graph to email, print or save to your Photo Album.
• Plenty of built-in options.
• AirDrop your graph to the most powerful data visualization application on the iPad, Graph IDE.
This Vvidget application is the same as the popular Graph application (also available on the App Store) except there is no additional in-app purchase.
WHAT IS A VVIDGET?
Vvidget is pronounced with only one "V" as in vijit. When you put the two Vs together they look like a W as in Widget. Vvidget makes widgets specific to graphical data reporting (information visualization). The three leading characters in Vvidget are VVI and VVI is the author of Vvidget. In a nutshell, "Vvidgets are widgets made by VVI".
The popular Graph application for iPad, iPhone, Mac (also available on the App Stores), the preeminent Graph IDE application for iPad, iPhone, Mac and the Web and this Vvidget application are based upon the Vvidget Codebase. You may download or use any of those applications to see the power of Vvidget. Vvidget expressions include forms-based HTTP SOA API to native Framework API. Very powerful and can be used out of the box by graphic artists and integrated into web-based dashboards as either a service or collocated. Not just the normal stuff, but also the stuff that makes your enterprise unique.
FEATURES
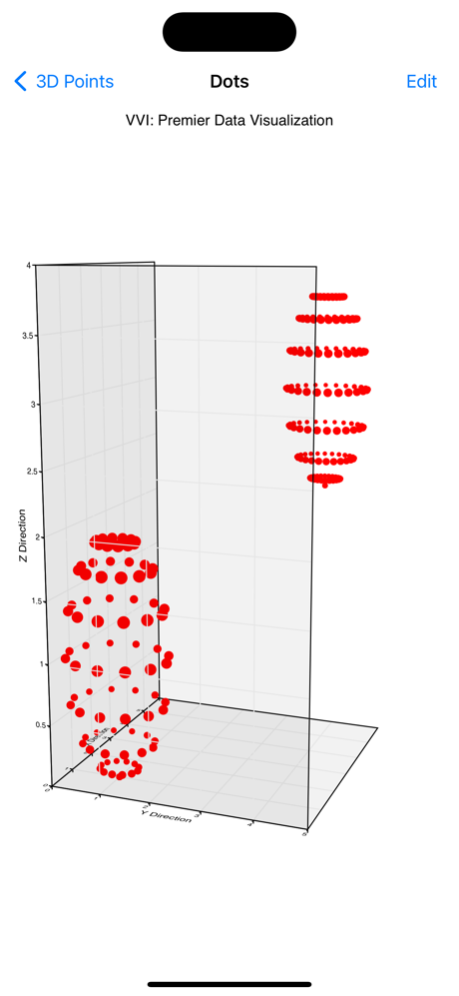
• Includes several 1D, 2D and 3D graph types such as bar, column, pie, line, area, scatter, 3D perspective scatter, trajectory and surface, volumetric, z-sliced cell, maps, linear, semi-log, x-log, log-log, polar, r-log, Gregorian date and many variations.
• Data is pasted from the pasteboard, fetched from web servers and inserted and edited using a table interface.
• Touch-hold a graph to export it to Graph IDE on the iPad. Graph IDE is the most powerful data visualization application for the iPad and gives access to a wide variety of graph types and graphical effects. (Graph IDE is separately available for the iPad).
• Touch graphs to rotate, zoom, scroll and scan data.
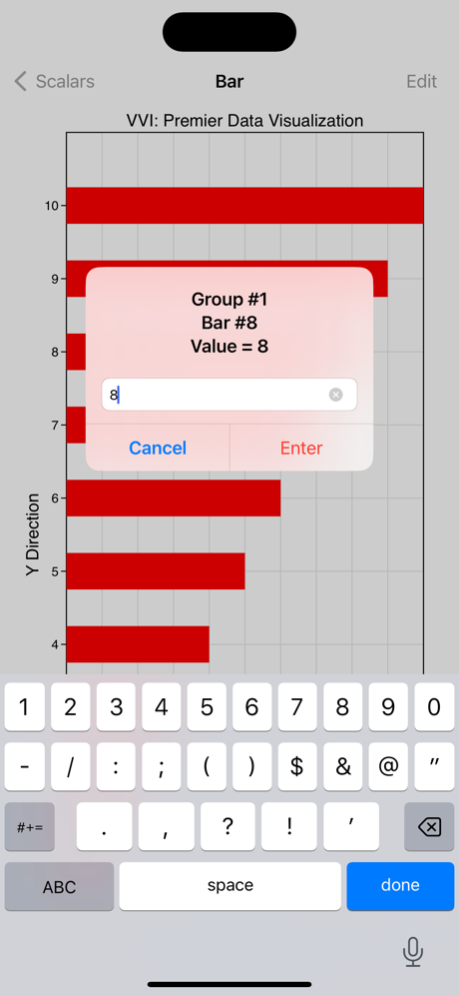
• Touch data graphics, such as lines and bars, to show data values.
• Touch-hold a graph to copy, print, mail, AirDrop and save it to other applications.
• Data and preferences are organized by project and each project is persistent and automatically saved so you can show and retrieve your settings and data on subsequent use.
• Thousands of graphic, graph and data attributes, including artwork, maps, autoscaling and many effects can be set by applying a skin made with Graph IDE (an optional macOS desktop application).
• Includes the Least Squares, Scatter Graph, Run 'n' Graph, Weight and Health application features as special-purpose interfaces.
• The Location Task can operate in the background acquiring GPS location coordinates and produce synthesized voice output streaming that ducks with music. Continued use of GPS running in the background can dramatically decrease battery life.
NOTE: Continued use of GPS running in the background can dramatically decrease battery life. The Location Tracking task requires GPS for its function.
Apr 23, 2024
Version 12.16.1
This version is faster and more secure. That is accomplished by pre-caching hashes and other deterministic values into the signed binaries. That means that the user interface is 2-4 times faster and common operations are much more immune to injection attempts or system changes. Being fast and secure translates into robust and dependable data visualization. The off-board control panels (selectors) have also been optimized for much better placement on the screen and performance in general. All state duplication is now much faster and more reliable. Transient tooltips are also many times faster. Menus are also many times faster. Tables are also much faster. A faster user interface (UI) translates into faster data visualization (DV) because DV and UI computations compete for resources. Reliable and secure means more immune to system changes and unaccounted for injection such as during operating system updating, hacking or changes in system API. Thousands of code points were also replaced with more secure implementations and the theoretically unsecured (and slower) code API is now removed.
Previous Versions
Here you can find the changelog of Vvidget since it was posted on our website on 2024-02-12 20:51:25.
The latest version is 12.16.1 and it was updated on 2024-04-25 20:07:55. See below the changes in each version.
Vvidget version 12.16.1
Updated At: 2024-04-23
Changes: Apr 23, 2024
Version 12.16.1
This version is faster and more secure. That is accomplished by pre-caching hashes and other deterministic values into the signed binaries. That means that the user interface is 2-4 times faster and common operations are much more immune to injection attempts or system changes. Being fast and secure translates into robust and dependable data visualization. The off-board control panels (selectors) have also been optimized for much better placement on the screen and performance in general. All state duplication is now much faster and more reliable. Transient tooltips are also many times faster. Menus are also many times faster. Tables are also much faster. A faster user interface (UI) translates into faster data visualization (DV) because DV and UI computations compete for resources. Reliable and secure means more immune to system changes and unaccounted for injection such as during operating system updating, hacking or changes in system API. Thousands of code points were also replaced with more secure implementations and the theoretically unsecured (and slower) code API is now removed.
Vvidget version 12.15.8
Updated At: 2024-03-18
Changes: Mar 18, 2024
Version 12.15.8
This is a maintenance release to synch with other derivatives and to synch the codebase for regression analysis.
Vvidget version 12.15.6
Updated At: 2024-02-13
Changes: Feb 13, 2024
Version 12.15.6
This is a maintenance release to synch with other derivatives and to synch the codebase for regression analysis.
Vvidget version 12.15.5
Updated At: 2024-02-06
Changes: Feb 6, 2024
Version 12.15.5
Table header pop-down menus are now more visually appealing and display much faster. Some user interface components are faster.
Disclaimer
Official App Store Link
We do not host Vvidget on our servers. We did not scan it for viruses, adware, spyware or other type of malware. This app is hosted by Apple and passed their terms and conditions to be listed there. We recommend caution when installing it.
The App Store link for Vvidget is provided to you by apps112.com without any warranties, representations or guarantees of any kind, so access it at your own risk.
If you have questions regarding this particular app contact the publisher directly. For questions about the functionalities of apps112.com contact us.